Introduction to using clusters
This page describes several ways to manage resources and also submit and monitor jobs in a high performance computing (HPC) environment.
- Training presentation (pdf)
Prerequisite: for better understanding of this course, users are expected to know a basic knowledge about Linux (Unix Shell) and terminal text editors. You can review:
Clusters
A cluster or supercomputer is a computer with a high level of performance as compared to a general-purpose computer. They have built for the purpose of massive parallelization to decrease computation time and get results faster. Each cluster consists of several components. The smallest element in a cluster is Processing Element (PE) that can be compared with personal computers’ cores. Tens of PEs create a Computational Node and hundreds of Nodes create a Partition, and finally putting Partitions together will create a cluster. Following shows hierarchy of a cluster.

Slurm
Slurm is an open source and highly scalable cluster management and job scheduling system for large and small Linux clusters. As a cluster workload manager, Slurm has three key functions.
- First, it allocates access to resources (compute nodes) to users for some duration of time so they can perform work
- Second, it provides a framework for starting, executing, and monitoring work (normally a parallel job) on the set of allocated nodes
- Finally, it arbitrates contention for resources by managing a queue of pending work (from Slurm overview)
Login node
Users connect to clusters through the login nodes.
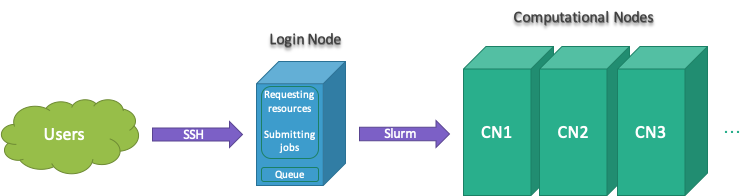
All jobs must be run using Slurm submitting tools to prevent running on the login node.
Cluster information
Slurm is a resource management system and has many tools to find available resources in the cluster. Following are set of Slurm commands for that purpose:
sinfo –s # summary of cluster resources (-s --summarize)
sinfo -p <partition-name> -o %n,%C,%m,%z # compute info of nodes in a partition (-o --format)
sinfo -p Gpu -o %n,%C,%m,%G # GPUs information in Gpu partition (-p --partition)
sjstat –c # show computing resources per node
scontrol show partition <partition-name> # partition information
scontrol show node <node-name> # node information
sacctmgr show qos format=name,maxwall,maxsubmit # show quality of services
For example the following shows output for sinfo -s
and sjstat -c commands:
[user@cluster-login-node ~]$ sinfo -s
PARTITION AVAIL  TIMELIMIT   NODES(A/I/O/T)  NODELIST
hpc          up 2-00:00:00          0/4/0/4  cluster-hpc1-node[908-911]
Interact     up 2-00:00:00          0/4/0/4  cluster-hpc2-node[908-911]
General*     up    2:00:00          0/4/0/4  cluster-hpc3-node[908-911]

[user@cluster-login-node ~]$ sjstat -c
Scheduling pool data:
-------------------------------------------------------------
Pool        Memory  Cpus  Total Usable   Free  Other Traits
-------------------------------------------------------------
hpc        122534Mb    24      4      4      4
Interact   122534Mb    24      4      4      4
General*   122534Mb    24      4      4      4
For instance above sinfo -s shows partition hpc3 has 4
idle nodes (free) and users can run jobs up 2 days. And,
sjstat -c shows that partition hpc3 has 4 nodes with 24
cpus and 122GB of memory on each node. In general,
CPUS/NODES(A/I/O/T) count of CPUs/nodes in the form
“available/idle/other/total” and S:C:T counts number of
“sockets, cores, threads”.
Users information
Users can use Slurm to find more information about their accounts, fairshare and quality of services (QOS) and several Unix commands to find their storage quotas.
sshare -U # show your fairshare and accounts (-U --Users)
sacctmgr show assoc user=$USER format=acc,user,share,qos,maxj # your QOS
groups # show your groups
df -h /home/$USER home # storage quota (-h --human-readable)
Job submission
All jobs must be run using srun or sbatch
to prevent running on the Cluster login node. In general, users can
request resources and run tasks interactively or create a batch file
and submit their jobs. The following graphs shows job submission
workflow:
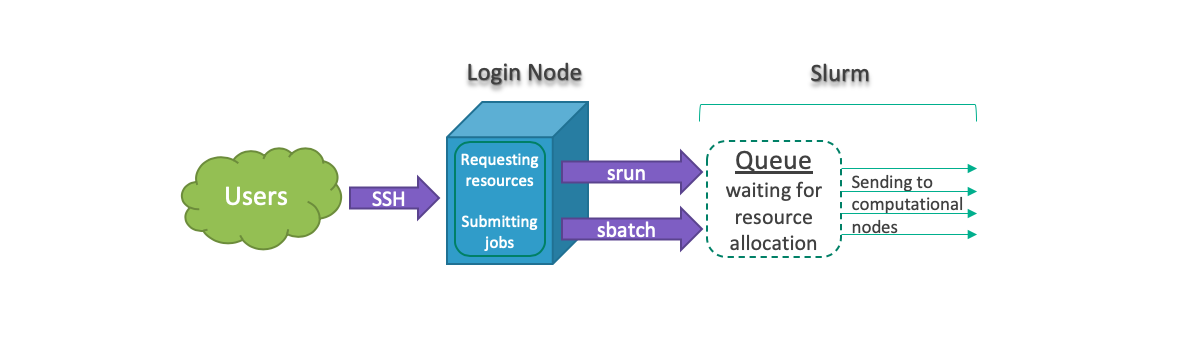
For running jobs interactively, we can use srun to
request required resources through Slurm and run jobs interactively.
For instance:
srun <slurm-options> <software-name/path>
srun --pty /bin/bash # requesting a pseudo terminal of bash shell to run jobs interactively
srun -p Interactive --pty /bin/bash # requesting a p.t. of bash shell on partition called Interactive (-p --partition)
srun -p <partition-name> -n 4 --mem 16G --pty /bin/bash # req. 4 tasks and 16G memory (-n --ntasks)
srun -p Gpu --gres gpu:1 -N 1 --ntasks-per-node 8 --pty /bin/bash # req. 1 GPU and 1 node for running 8 tasks on Gpu partition (-N --nodes)
For submitting jobs, we can create a batch file, which is a shell
script (#!/bin/bash) including Slurm options
(#SBATCH) and computational tasks, and use:
sbatch <batch-file> After job completion we will receive outputs
i.e. slurm-jobid.out.
Slurm has several options that help users manage their jobs requirement, such that:
-p --partition <partition-name>       --pty <software-name/path>
--mem <memory>                        --gres <general-resources>
-n --ntasks <number of tasks>         -t --time <days-hours:minutes>
-N --nodes <number-of-nodes>          -A --account <account>
-c --cpus-per-task <number-of-cpus>   -L --licenses <license>
-w --nodelist <list-of-node-names>    -J --job-name <jobname>
Also, Slurm has several environmental variables that contain details such as job id, job name, host name and more. For instance:
$SLURM_JOB_ID
$SLURM_JOB_NAME
$SLURM_JOB_NODELIST
$SLURM_CPUS_ON_NODE
$SLURM_SUBMIT_HOST
$SLURM_SUBMIT_DIR
For example let’s consider the following Python code, called
test.py:
#!/usr/bin/env python3
import os

os.system("""
echo hostname: $(hostname)
echo number of processors: $(nproc)
echo data: $(date)
echo job id: $SLURM_JOB_ID
echo submit dir: $SLURM_SUBMIT_DIR
""")

print("Hello world”)
To run the above code, we can use srun to run
test.py interactively on a partition called Interactive
such that:
srun -p Interactive -n 4 --mem 8G --pty bash

python3 test.py
Or create a batch file, called jobpy.sh, such
that:
#!/bin/bash

#SBATCH -p Interactive
#SBATCH -n 4
#SBATCH --mem 8G

python3 test.py
And use sbatch to submit the batch file:
sbatch jobpy.shJob Arrays
If you have a plan to submit large number of jobs at the same time in parallel, Slurm job array can be very helpful. Note that in most of the parallel programming methods we submit a single script to run but in a way that each iteration of running the same code return different results.
Job arrays use the following environment variables:
SLURM_ARRAY_JOB_IDkeeps the first job ID of the arraySLURM_ARRAY_TASK_IDkeeps the job array index valueSLURM_ARRAY_TASK_COUNTkeeps the number of tasks in the job arraySLURM_ARRAY_TASK_MAXkeeps the highest job array index valueSLURM_ARRAY_TASK_MINkeeps the lowest job array index value
Python example
The following shows a simple example of using Slurm job array and
Python to submit jobs in parallel. Each of these jobs get a seperate
memory and CPU allocation to run tasks in parallel. Let’s create the
following Python script called array-test.py:
#!/usr/bin/env python3

import os

## Computational function
def comp_func(i):
    host = os.popen("hostname").read()[:-1] # find host's name
    ps = os.popen("cat /proc/self/stat | awk '{print $39}'").read()[:-1] # find cpu's id
    return "Task ID: %s, Hostname: %s, CPU ID: %s" % (i, host, ps)

## Iterate to run the computational function
task_id = [int(os.getenv('SLURM_ARRAY_TASK_ID'))]
for t in task_id:
    print(comp_func(t))
The following is a batch file called array-job.sh:
#!/usr/bin/bash

#SBATCH --partition hpc3
#SBATCH --job-name array
#SBATCH --array 1-9
#SBATCH --output output-%A_%a.out

python3 ./array-test.py
You can submit the batch file by:
sbatch array-job.shThe output is:
[user@clark-r630-login-node907 hpc-intro]$ cat output-*
Task ID: 1, Hostname: clark-r630-hpc3-node908, CPU ID: 0
Task ID: 2, Hostname: clark-r630-hpc3-node908, CPU ID: 2
Task ID: 3, Hostname: clark-r630-hpc3-node908, CPU ID: 4
Task ID: 4, Hostname: clark-r630-hpc3-node908, CPU ID: 6
Task ID: 5, Hostname: clark-r630-hpc3-node908, CPU ID: 8
Task ID: 6, Hostname: clark-r630-hpc3-node908, CPU ID: 10
Task ID: 7, Hostname: clark-r630-hpc3-node908, CPU ID: 12
Task ID: 8, Hostname: clark-r630-hpc3-node908, CPU ID: 14
Task ID: 9, Hostname: clark-r630-hpc3-node908, CPU ID: 16
R example
Let’s use job arrays to rerun the following R script
(array-test.R) simultaneously with different seeds
(starting point for random numbers):
#!/usr/bin/env R

system("echo Date: $(date)", intern = TRUE)

args = commandArgs(trailingOnly = TRUE)
myseed = as.numeric(args[1])

set.seed(myseed)
print(runif(3))
The following is a batch file called
array-job-r.sh:
#!/usr/bin/bash

#SBATCH --partition Lewis
#SBATCH --job-name r-seed
#SBATCH --array 1-12%4 # %4 will limit the number of simultaneously running tasks from this job array to 4
#SBATCH --output Rout-%A_%a.out

module load r
Rscript array-test.R ${SLURM_ARRAY_TASK_ID}
You can submit the batch file by:
sbatch array-job-r.shThe output is:
[user@lewis4-r630-login-node675 test-array]$ cat Rout-*
[1] "Date: Tue Feb 16 18:21:15 CST 2021"
[1] 0.5074782 0.3067685 0.4269077

[1] "Date: Tue Feb 16 18:21:15 CST 2021"
[1] 0.2772497942 0.0005183129 0.5106083730

[1] "Date: Tue Feb 16 18:21:15 CST 2021"
[1] 0.06936092 0.81777520 0.94262173

[1] "Date: Tue Feb 16 18:21:15 CST 2021"
[1] 0.7103224 0.2461373 0.3896344
Monitoring jobs
The following Slurm commands can be used to monitor jobs:
sacct -X # show your jobs in the last 24 hours (-X --allocations)
sacct -X -S <yyyy-mm-dd> # show your jobs since a date (-S --starttime)
sacct -X -S <yyyy-mm-dd> -E <yyyy-mm-dd> -s <R/PD/F/CA/CG/CD> # show running/pending/failed/cancelled/completing/completed jobs in a preiod of time (-s --state)
sacct -j <jobid> # show more details on selected jobs (-j --jobs)
squeue -u <username> # show a user jobs (R/PD/CD) in the queue (-u --user)
squeue -u <username> --start # show estimation time to start pending jobs
scancel <jobid> # cancel jobs
Monitor CPU and memory
Completed jobs
We can use the following options to check how many resouces is consumed by a completed job.
sacct -j <jobid> -o User,Acc,AllocCPUS,Elaps,CPUTime,TotalCPU,AveDiskRead,AveDiskWrite,ReqMem,MaxRSS # info about CPU and virtual memory for compeleted jobs (-j --jobs)
seff <jobid> # show job CPU and memory efficiency
For more information on what fields to include see
man sacct.
Example output:
[user@cluster-login-node675 ~]$ sacct -j 10785018 -o User,Acc,AllocCPUS,Elaps,CPUTime,TotalCPU,ReqMem,MaxRSS
     User    Account  AllocCPUS    Elapsed    CPUTime   TotalCPU     ReqMem     MaxRSS
--------- ---------- ---------- ---------- ---------- ---------- ---------- ----------
     user    general         16   00:48:39   12:58:24  01:49.774       64Gn       216K

[user@cluster-login-node ~]$ seff 10785018
Job ID: 10785018
Cluster: cluster4
User/Group: user/rcss
State: COMPLETED (exit code 0)
Nodes: 1
Cores per node: 16
CPU Utilized: 00:01:50
CPU Efficiency: 0.24% of 12:58:24 core-walltime
Memory Utilized: 3.38 MB (estimated maximum)
Memory Efficiency: 0.01% of 64.00 GB (64.00 GB/node)
Running jobs
Slurm provides a tool to monitor running jobs. In order for this to
work jobs using SBATCH must utilize the srun command
within the job file.
sstat <jobid> -o AveCPU,AveDiskRead,AveDiskWrite,MaxRSS # info about CPU and memory for runing jobs (srun only)Also, we can use top command to find how much CPU and
memory are using by a submitted job. To do that, we need to attach to
the nodes that our job is running and run top
command.
srun --jobid <jobid> --pty /bin/bash

top -u $USER
For Memory usage, the number you are interested in is RES. In case below, python3 program is using about 5.6Mb memory and 0% of the requested CPUs.
  PID USER     PR  NI    VIRT    RES    SHR S  %CPU %MEM     TIME+ COMMAND
14278 Buzz     20   0  124924   5612   2600 S   0.0  0.0   0:00.04 python3
14279 Buzz     20   0  124924   5612   2600 S   0.0  0.0   0:00.03 python3
Modules
In order to use a software, we need to load the corresponding module first. The following commands let us manage modules in our workflow:
module avail # available modules
module show # show modules info
module list # list loaded modules
module load # loaded modules
module unload # unload loaded modules
module purge # unload all loaded modules
Never load modules in the login node. It makes login node slow for all users and many modules don’t work in the login node.
For example to use R interactively, first need to request resources
on a partition called Interactive by srun and then use
module load R:
srun -p Interactive --mem 4G --pty /bin/bash
module load R
R
If you are looking for using a licensed software (available in cluster) make sure you call the license when requesting resources. For instance to use MATLAB:
srun -p Interactive --mem 4G -L matlab --pty /bin/bash
module load matlab
matlab -nodisplay